Introduction
In order to measure the concentration of espresso on a refractometer, one is supposed to first filter the espresso to minimize the potential for error. In order to get around some of the waste and the cost of using a new VST filter for every measurement, a few people have proposed centrifuging samples to separate the sediment and oils out of the espresso. Kostverlorenvaart, a blog by Frans Goddjin, has a couple posts briefly touching on the subject from which I first heard about it. But the testing done is only minimal, and using equipment with lower resolution. So I wanted to test for myself, can centrifuging provide consistent results like VST filters? Can it provide the same answers? Is filtering espresso actually necessary at all?
This experiment is designed to test the readings given by a VST Coffee Lab III measuring espresso that has been filtered with a VST syringe filter, versus espresso that has been centrifuged, versus entirely unfiltered espresso. The test is meant to find the difference between VST syringe filters and centrifuged espresso or unfiltered espresso, as well as to find the variance in each method when measuring the same shot.
This experiment is NOT, however, meant to claim one measurement method is closest to the true TDS of the espresso sample that could be found with a drying oven. And, while you may choose to use the data contained here as a part of making your choices, this experiment is not meant to recommend any particular method or product.
I get into some of my personal feelings on these results on the corresponding Blog Post, but I’m leaving this page to just experimental findings.
Jonathan Gagné will be joining us to provide some useful insight on the data collected and plots to help us visualize what’s going on. Check out his blog, Coffee Ad Astra, coffee brewing with a scientific focus. There’s some seriously great content on coffee extraction, blind testing, grinding, brewing, and more.
Experiment Design
In order to explain this experiment and analyze the data, I’ll need to use a fair bit of jargon. If you’re not familiar with coffee terminology and basic statistical terminology, you might want to check out the Glossary first. Don’t worry, if you already know coffee stuff but not statistics stuff or vice versa, the page is split up so you can just read what you need.
General Procedures
| Shot preparation | Espresso is stirred ten times clockwise and ten times counterclockwise in the cup with a clean glass rod. After stirring, espresso is poured into a clean glass that has been rinsed with RO water and thoroughly dried. All sampling is done from this cup. |
| Refractometer cleaning | The espresso left on the lens of the device is removed with a pipette. The lens is then wiped with a paper towel to remove leftover espresso, then cleaned with an alcohol wipe. The lens is then rinsed with distilled water and dried. |
| Refractometer zeroing | Before testing, the refractometer is zeroed by placing distilled water on the lens of the device and using the zeroing function. The lens is then dried. |
| Number of samples | For each method used, two samples are taken from the shot. One of each method, followed by one of each method again in the same order as the first time. |
| Ordering | Samples are both taken and measured in the order “VST 1, Centrifuge 1, Unfiltered 1, VST 2, Centrifuge 2, Unfiltered 2” |
VST syringe filter specific procedures
| Sampling for syringe filters | Espresso is drawn into an unused plastic disposable syringe up to the 5ml mark and pushed back into the cup five times. The sixth draw is kept. |
| Filtering with syringe filters | Espresso is pushed through an usused VST syringe filter. The first 10 drops are discarded in a waste cup, and the rest is placed into a clean glass rinsed with RO water and thoroughly dried. |
| Measuring with syringe filters | Filtered espresso is stirred, then picked up with an usused disposable pipette and placed on the lens of the VST Coffee Lab III. New measurements are taken until the TDS reading remains stable and does not change across measurements. |
Centrifuge specific procedures
| Sampling for centrifuging | Espresso is drawn into an usused plastic disposable syringe and pushed back into the cup three times. The fourth draw is placed in an usused plastic disposable 1.5ml centrifuge tube. |
| Centrifuging | Tubes are loaded evenly in the centrifuge and spun at 13,000 rpm for 5 minutes. |
| Transfer to pipette | Espresso is drawn from the centrifuge tube, being careful not to disturb the sediment at the bottom or to draw in any oils from the top, into an unused plastic disposable pipette. |
| Measuring after centrifuging | The first drops of espresso are pushed through the pipette and discarded, to be rid of any that may have evaporated in the tube. The remainder is placed on the lens of the VST Coffee Lab III. New measurements are taken until the TDS reading remains stable and does not change across measurements. |
Unfiltered specific procedures
| Sampling for unfiltered | Espresso is drawn into an usused plastic disposable pipette and pushed back into the cup three times. The fourth draw is kept. |
| Measuring unfiltered | Espresso is placed directly from the pipette onto the lens of the VST Coffee Lab III. New measurements are taken until the TDS reading remains stable and does not change across measurements. |
General notes
| Espresso consistency | No effort is made to be consistent with espresso shots. This test is only of the filtration methods. |
| Other devices | As this test is conducted only with a VST Coffee Lab III, I can not make any claims to how these same methods compare with any other devices. I would suggest repeating the experiment yourself should you with to use the conclusions with a different device. |
| Experimental vs everyday | For the purposes of this experiment, I’m doing some things I do not recommend for everyday use. Opening a new syringe for each sample, using a new centrifuge tube for each sample, etc. In my normal day to day use, I have no problems using a syringe (not a syringe filter) several times, using washable glass pipettes, reusing centrifuge tubes, etc. |
Comparison of Variation
A good filtration method should minimize variation between readings of the same shot. In order to test the variance of our methods, we take two samples with each method for each shot as discussed in the experiment design. Keep in mind that espresso is not a homogeneous liquid. I make efforts in this experiment to mix it well before sampling, but I cannot be sure it’s done perfectly. Variation existing, or differing between shots, is not a mark against a method. What we’re looking for is differences between the methods that persist over many trials.
Measured Variance values per shot
This table here contains the variation within the same method for each shot measured. If you’d like to see the shot measurements that went into this, they’ll all be posted at the end of the page. These are calculated as \(|Sample 1 – Sample 2|\). Absolute value is used because we want to know how far apart the samples are, not the direction.
| VST Variation | Centrifuge Variation | Unfiltered Variation | |
|---|---|---|---|
| Shot 1 | 0.04% | 0.08% | 0.09% |
| Shot 2 | 0.02% | 0.02% | 0.11% |
| Shot 3 | 0.04% | 0.05% | 0.03% |
| Shot 4 | 0.02% | 0.00% | 0.01% |
| Shot 5 | 0.02% | 0.33% | 0.04% |
| Shot 6 | 0.02% | 0.01% | 0.10% |
| Shot 7 | 0.01% | 0.02% | 0.13% |
| Shot 8 | 0.04% | 0.04% | 0.06% |
| Shot 9 | 0.04% | 0.02% | 0.05% |
| Shot 10 | 0.03% | 0.04% | 0.03% |
| Shot 11 | 0.03% | 0.03% | 0.13% |
| Shot 12 | 0.05% | 0.01% | 0.10% |
| Shot 13 | 0.03% | 0.04% | 0.05% |
| Shot 14 | 0.02% | 0.02% | 0.30% |
| Shot 15 | 0.03% | 0.03% | 0.25% |
| Shot 16 | 0.07% | 0.00% | 0.49% |
| Shot 17 | 0.00% | 0.02% | 0.21% |
| Shot 18 | 0.05% | 0.01% | 0.05% |
| Shot 19 | 0.00% | 0.02% | 0.22% |
| Shot 20 | 0.04% | 0.03% | 0.22% |
Variation Comparisons
Now we’ll take these data and use the MAD (Median Absolute Deviation, similar to a standard deviation but more rubust against outliers) to determine the precision of each method, with the help of Jonathan Gagné. Smaller numbers are better here and represent lower difference between readings. Don’t worry about the blank accuracy and systematic difference, we’ll be coming back to those very soon.
For reference, the formula used is \(MAD = 1.4826*MEDIAN(ABS(X-MEDIAN(X)))\)
| VST | Centrifuge | Unfiltered | |
|---|---|---|---|
| Precision | 0.01% | 0.01% | 0.09% |
| Accuracy | - | ||
| Systematic Difference | - |
To help visualize the difference more intuitively, Jonathan has also provided us an excellent kernel density plot, which represents the number of measurements for each size of absolute deviation.

We can see a clear difference between the variation of unfiltered samples versus samples taken with both filtration methods, with a significantly worse median precision and a much wider set of deviations. This means that not only are the unfiltered samples further apart, but it’s less predictable how far apart the readings will be.
The two filtration methods, on the other hand, are very close in terms of precision. Save for a notable outlier in the centrifuged samples, which I believe comes from disturbing the sediment at the bottom of the centrifuge tube. A reminder that centrifuging is not foolproof, and careful sampling is vital to ensure accurate results. If desired, you could minimize the risk of an error like this by taking two samples and using the lower of the two instead of balancing your sample with distilled water in the centrifuge (balacing, in some way, is mandatory for safety).
Comparison to VST
VST syringe filters are somewhat of an industry standard in specialty coffee. Because of this, knowing how a method compares to VST filters is valuable as well as knowing the variation of the method. So we’ll be using VST filters as the standard for perfectly accurate against which to measure the others.
I make no claims as to whether VST filters are or are not an accurate measure of true extraction yield. I do not have access to equipment which can measure true extraction yield, so I can only compare industry standard to alternatives.
Measured differences per shot
This table here contains the differences between the VST readings and the other methods. These are calculated as $Average VST – Average [Other Method]$. Absolute value is not used this time, as we do care if the reading is higher or lower than VST.
| Centrifuge minus VST | Unfiltered minus VST | |
|---|---|---|
| Shot 1 | 0.08% | 0.36% |
| Shot 2 | 0.06% | 0.32% |
| Shot 3 | 0.03% | 0.27% |
| Shot 4 | 0.04% | 0.31% |
| Shot 5 | 0.17% | 0.38% |
| Shot 6 | 0.04% | 0.35% |
| Shot 7 | 0.01% | 0.36% |
| Shot 8 | 0.03% | 0.33% |
| Shot 9 | -0.01% | 0.24% |
| Shot 10 | 0.03% | 0.32% |
| Shot 11 | 0.03% | 0.39% |
| Shot 12 | 0.02% | 0.60% |
| Shot 13 | 0.03% | 0.41% |
| Shot 14 | 0.01% | 0.48% |
| Shot 15 | 0.00% | 0.56% |
| Shot 16 | 0.03% | 0.79% |
| Shot 17 | 0.02% | 0.71% |
| Shot 18 | 0.02% | 0.35% |
| Shot 19 | -0.01% | 0.76% |
| Shot 20 | 0.03% | 0.58% |
Comparison of differences
We can see here that unfiltered measures higher than the VST readings in all 20 trials. The centrifuged reads higher in 17/20 (85%), equal in 1/20 (5%), and lower in 2/20 (10%) of trials.
Let’s see where the statistics fall for it, and once again Jonathan Gagné comes through with some great plots like for the variation. Please note the different scales on the X axis for making both plots readable. Here we fill in the accuracy and systematic difference.
| VST | Centrifuge | Unfiltered | |
|---|---|---|---|
| Precision | 0.01% | 0.01% | 0.09% |
| Accuracy | - | 0.01% | 0.11% |
| Systematic Difference | - | +0.03% | +0.38% |
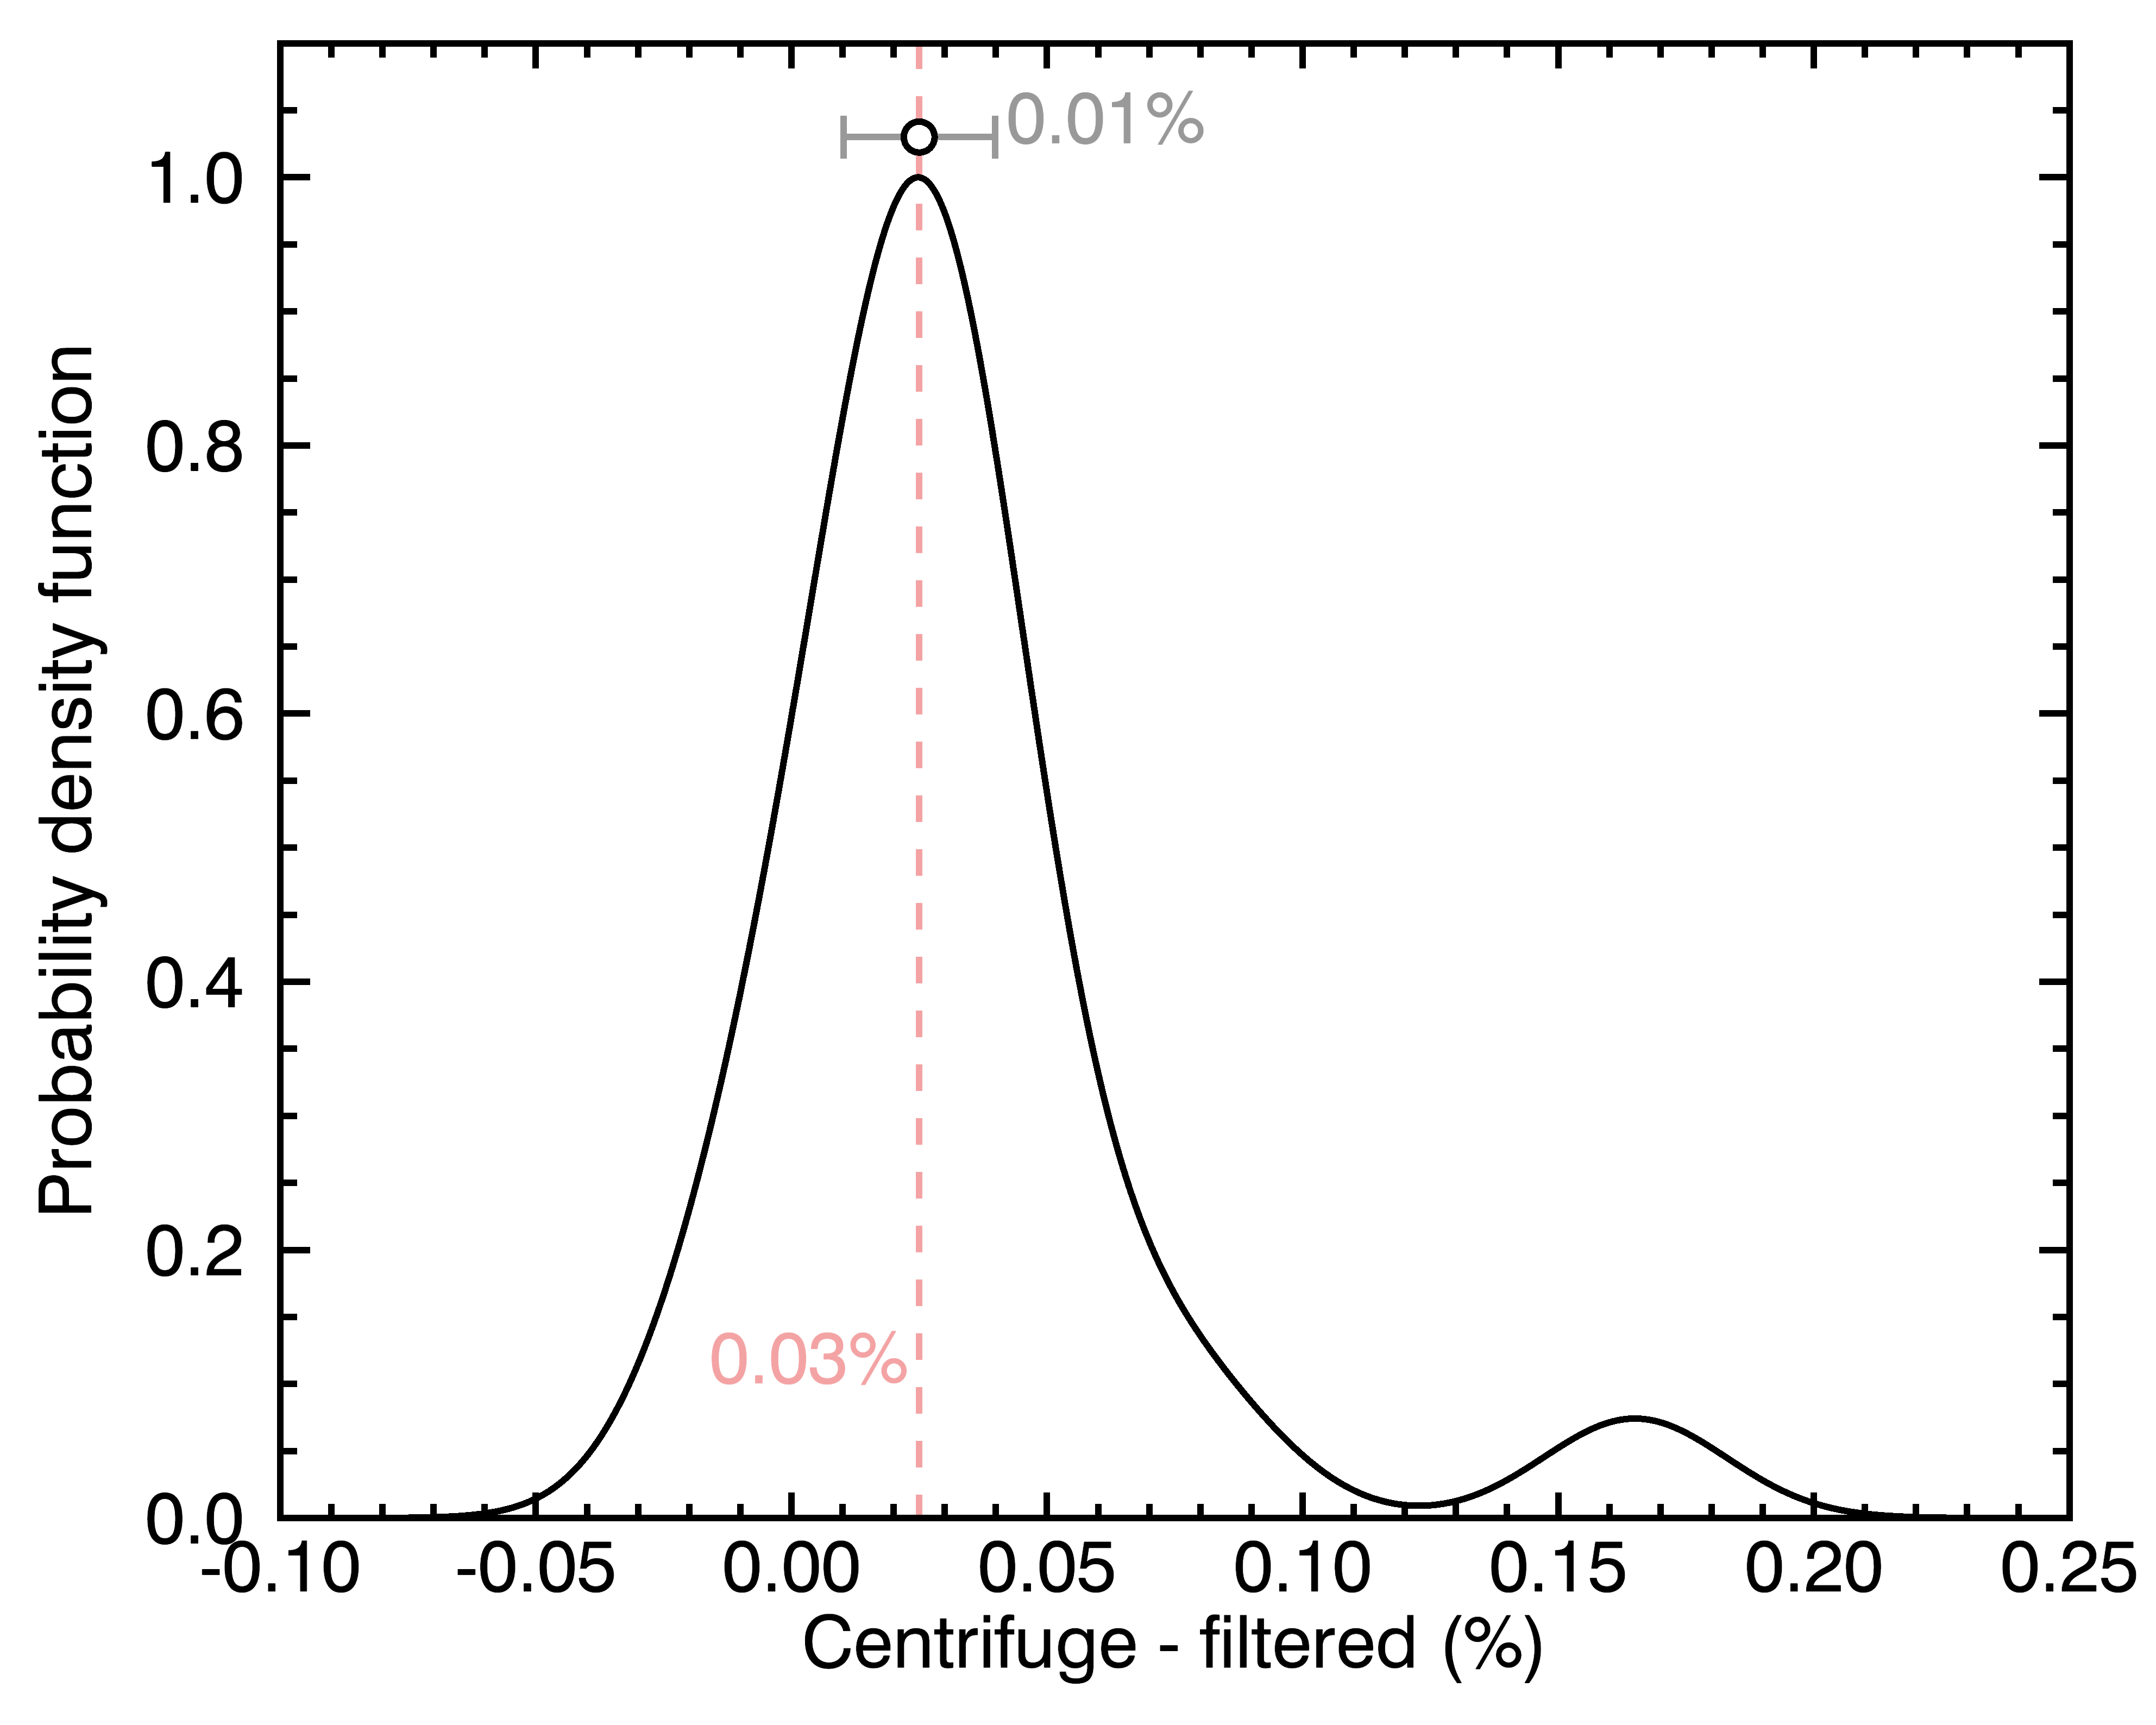
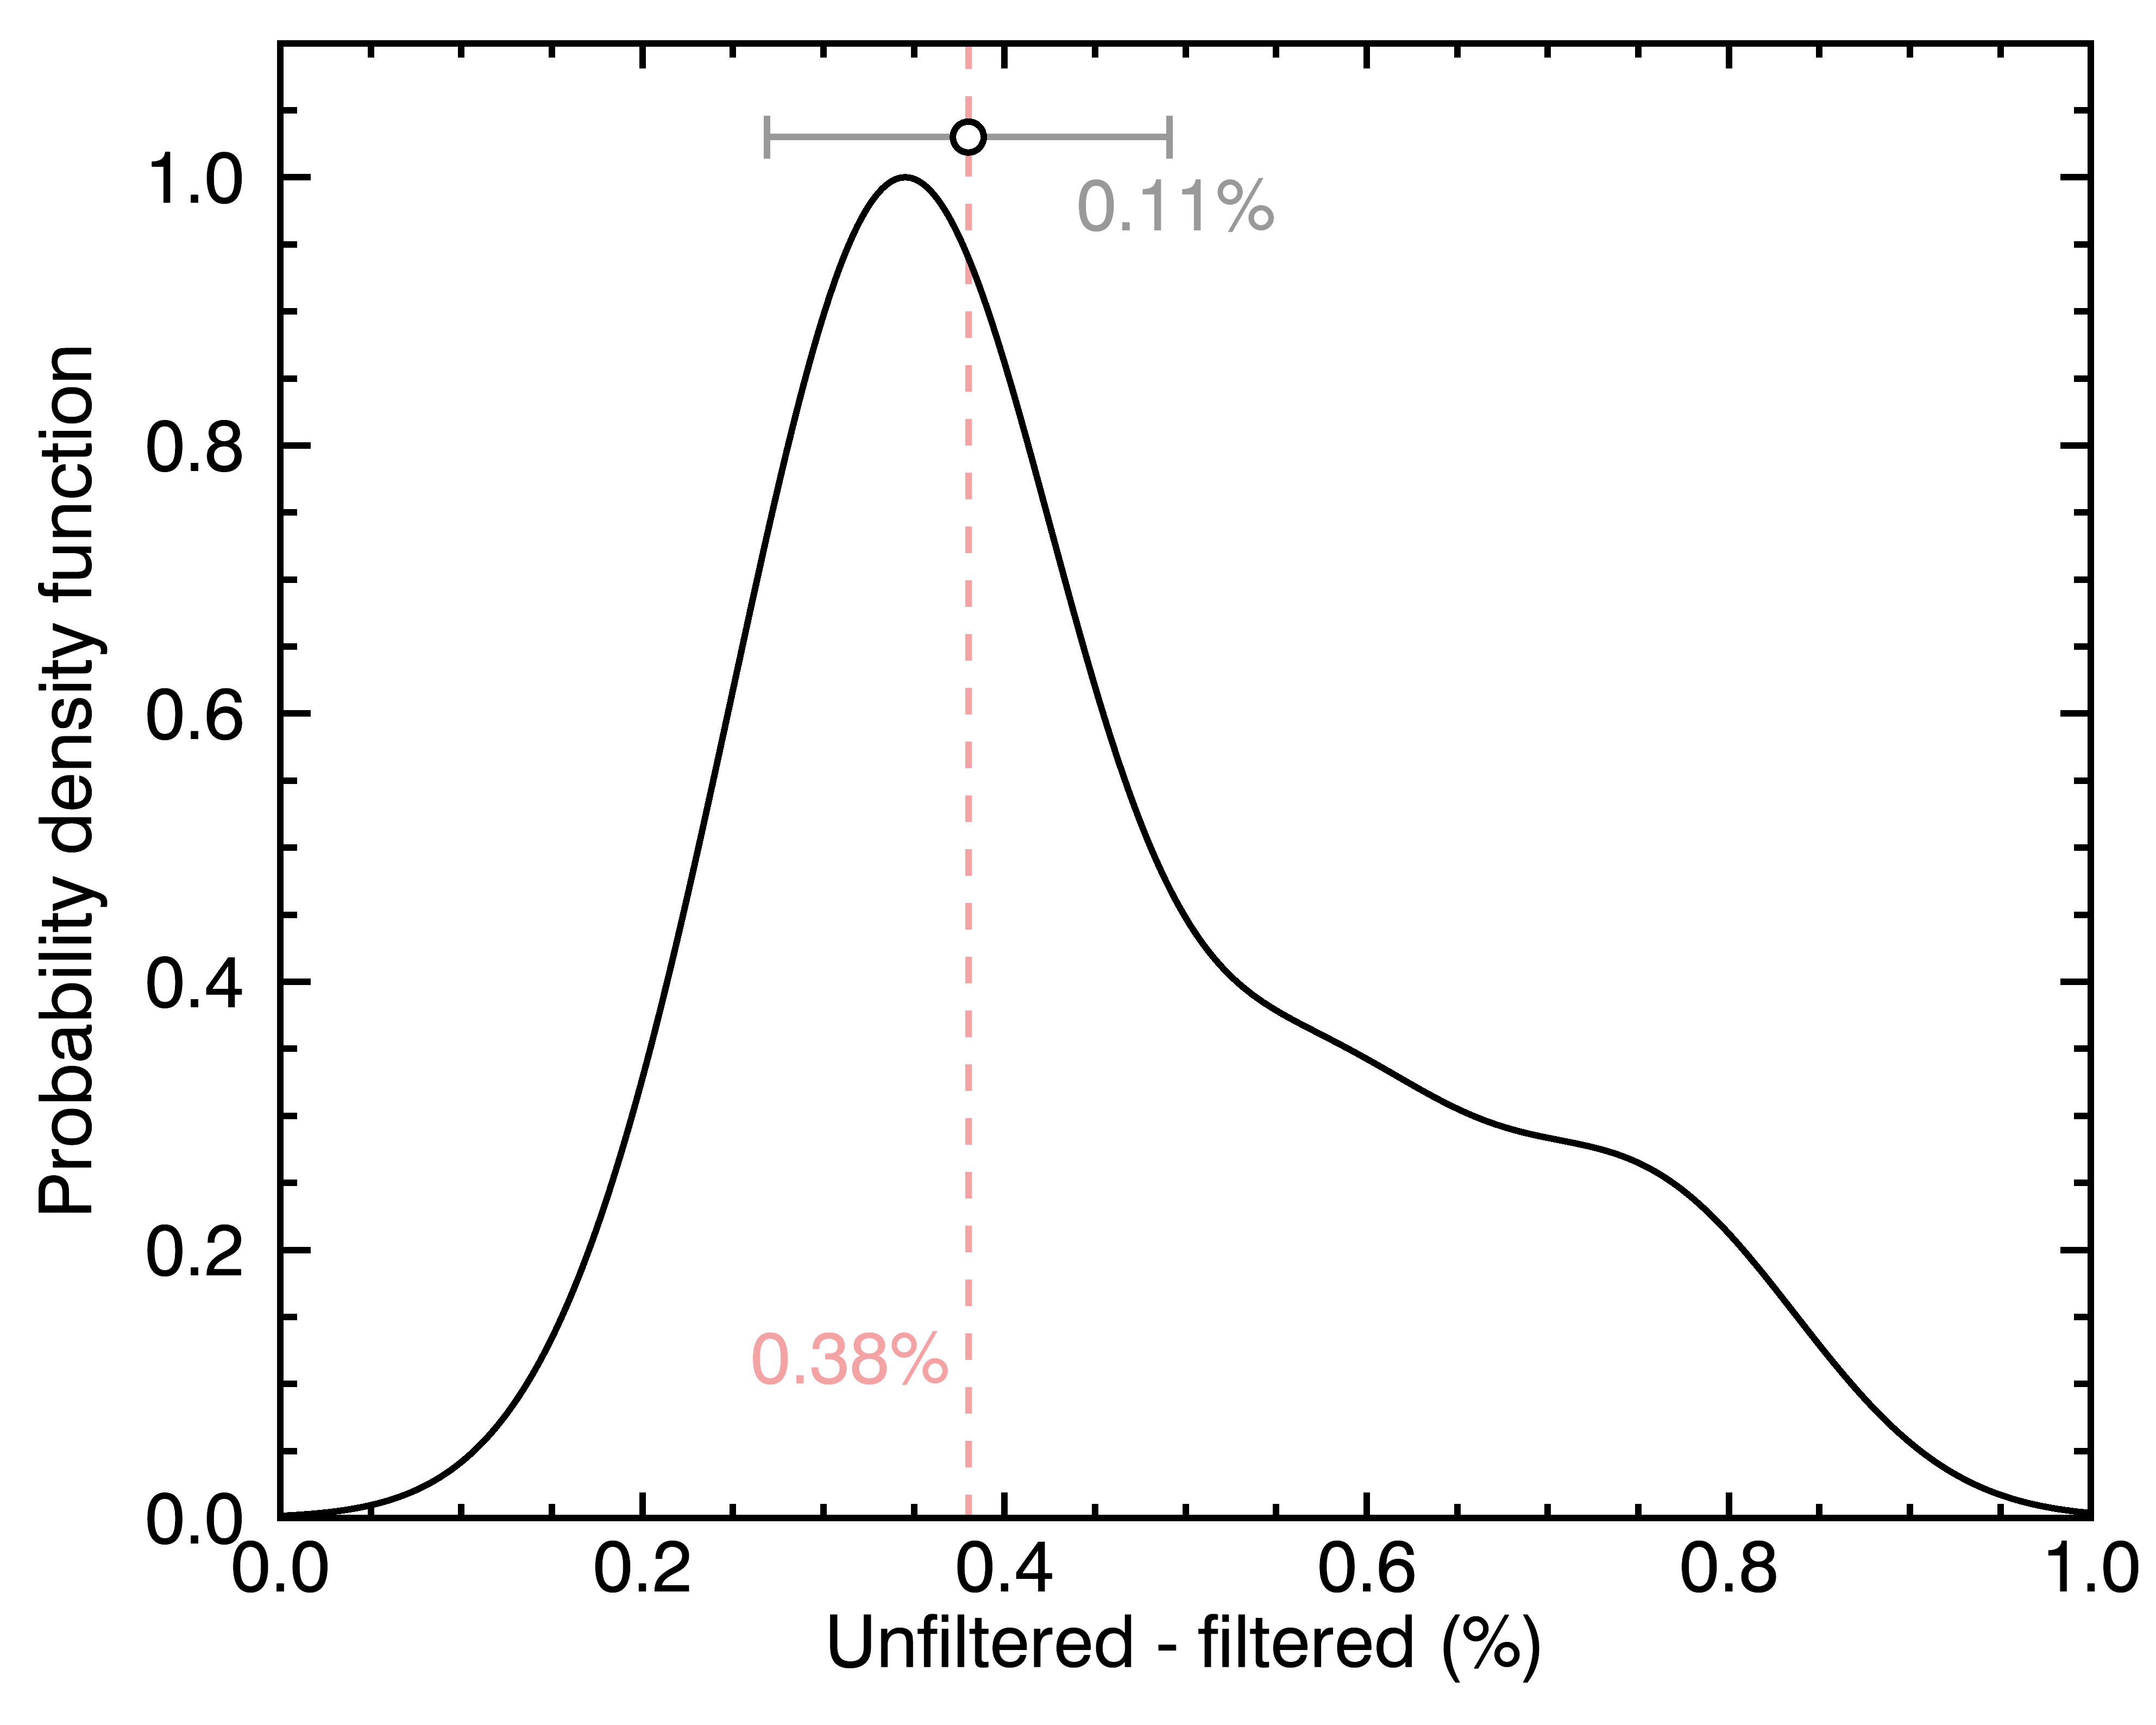
Looks like we have a median reading .03% higher than VST on centrifuged samples, and a median reading .38% higher than VST on unfiltered ones. We also notice a much wider variance (0.11% MAD) in how far the reading is from VST on the unfiltered samples, versus the filtered samples (0.01% MAD).
Conclusions
On VST
VST filters perform similarly to centrifuging on minimizing variation, and much better than unfiltered.
The readings being only minimally lower than centrifuged samples also indicates that the filters are not removing a substantial amount of dissolved solids along with the undissolved solids and oils they are designed to remove. A concern that I’ve seen in some forums and comments sections that I’m glad to have been able to address here.
Determination: Precise, and the comparison to centrifuging makes me want to say the accuracy we take for granted is well earned.
On Centrifuging
Centrifuging performs similarly to VST filters on minimizing variation, and much better than unfiltered. The departure from VST filter readings is fairly consistently higher (85% of the time in these trials), but minimally so.
Determination: both precise and consistent with syringe filters.
On Unfiltered
Unfiltered espresso has significantly higher variation than either VST filters or centrifuging. It also has a much larger departure from the VST filter readings when compared to centrifuging, with error bars 9 times larger.
Determination: Neither precise nor consistent with syringe filters.
Full Data
Below you will find a table with the full set of measurements collected for this testing. If you would like to see more data not necessarily relevant to this experiment, such as room temperature and shot ratios, you can look at the Google Sheets document I used during logging. I’m also happy to answer any questions you might have in the comments if I’ve left anything unaddressed.
| Coffee | VST 1 | VST 2 | Centrifuge 1 | Centrifuge 2 | Unfiltered 1 | Ulfiltered 2 | |
|---|---|---|---|---|---|---|---|
| Shot 01 | Sump Ethiopia Roba | 8.34% | 8.30% | 8.36% | 8.44% | 8.72% | 8.63% |
| Shot 02 | Sump Ethiopia Roba | 8.51% | 8.49% | 8.57% | 8.55% | 8.76% | 8.87% |
| Shot 03 | Sump Ethiopia Roba | 8.26% | 8.22% | 8.24% | 8.29% | 8.49% | 8.52% |
| Shot 04 | Sump Ethiopia Roba | 8.50% | 8.48% | 8.53% | 8.53% | 8.79% | 8.80% |
| Shot 05 | Sump Ethiopia Roba | 8.67% | 8.65% | 8.66% | 8.99% | 9.06% | 9.02% |
| Shot 06 | Sump Ethiopia Roba | 7.91% | 7.89% | 7.93% | 7.94% | 8.20% | 8.30% |
| Shot 07 | Sump Ethiopia Roba | 8.41% | 8.40% | 8.41% | 8.43% | 8.83% | 8.70% |
| Shot 08 | Sump Ethiopia Roba | 8.32% | 8.28% | 8.31% | 8.35% | 8.66% | 8.60% |
| Shot 09 | Sump Ethiopia Roba | 7.91% | 7.87% | 7.87% | 7.89% | 8.15% | 8.10% |
| Shot 10 | Sump Ethiopia Roba | 8.73% | 8.70% | 8.73% | 8.77% | 9.02% | 9.05% |
| Shot 11 | Sump Costa Alma Negra | 7.98% | 7.95% | 7.98% | 8.01% | 8.29% | 8.42% |
| Shot 12 | Sump Costa Alma Negra | 8.56% | 8.51% | 8.55% | 8.56% | 9.08% | 9.18% |
| Shot 13 | Sump Costa Alma Negra | 8.28% | 8.25% | 8.28% | 8.32% | 8.65% | 8.70% |
| Shot 14 | Sump Costa Alma Negra | 8.31% | 8.29% | 8.30% | 8.32% | 8.63% | 8.93% |
| Shot 15 | Sump Costa Alma Negra | 8.67% | 8.64% | 8.64% | 8.67% | 9.09% | 9.34% |
| Shot 16 | Sump Costa Alma Negra | 8.22% | 8.15% | 8.21% | 8.21% | 8.73% | 9.22% |
| Shot 17 | Sump Costa Alma Negra | 7.81% | 7.81% | 7.82% | 7.84% | 8.41% | 8.62% |
| Shot 18 | Sump Costa Alma Negra | 7.92% | 7.87% | 7.92% | 7.91% | 8.22% | 8.27% |
| Shot 19 | Sump Costa Alma Negra | 8.39% | 8.39% | 8.37% | 8.39% | 9.26% | 9.04% |
| Shot 20 | Sump Costa Alma Negra | 8.21% | 8.17% | 8.20% | 8.23% | 8.66% | 8.88% |